Methods & Monitoring Progress

Using rigorous data collection and scientific analysis, we track vessel speeds, whale strikes, underwater noise pollution, and air emissions to measure the impact of speed reductions.

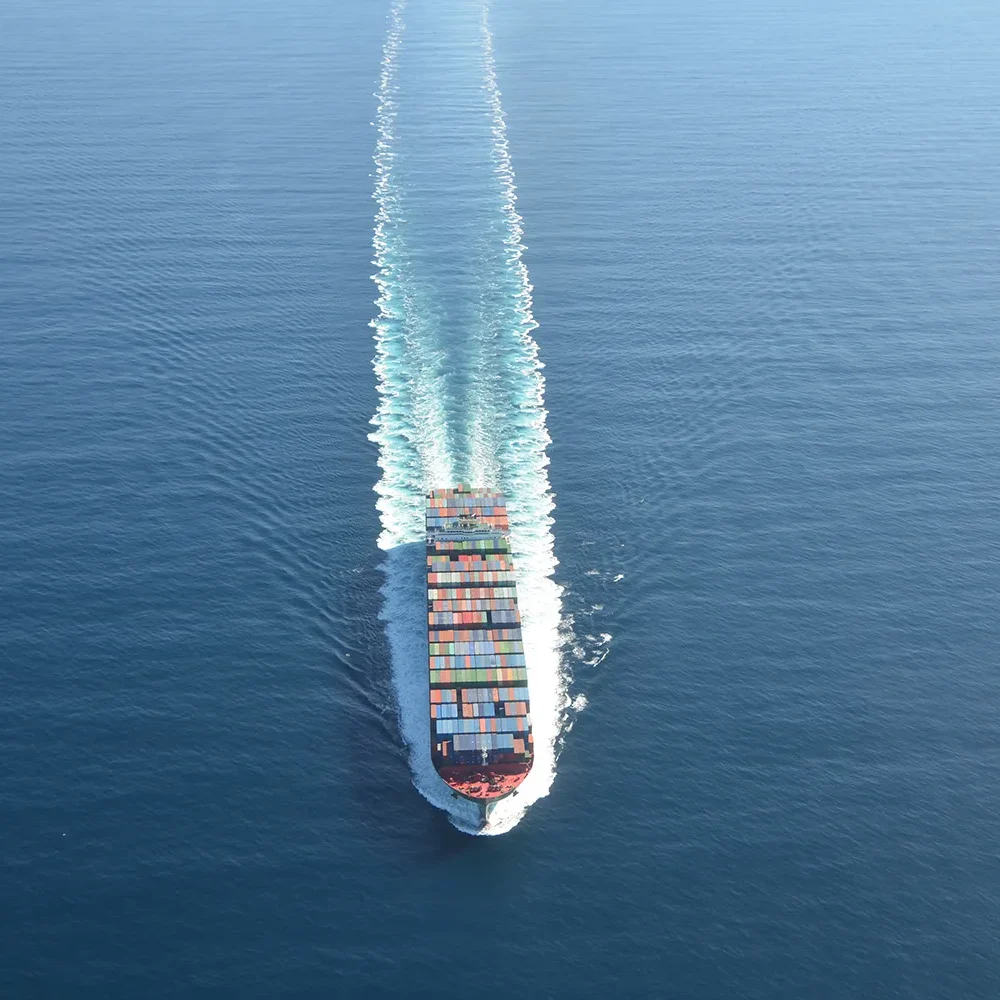
Photo: Guille Pozzi

wake-skyblue-right
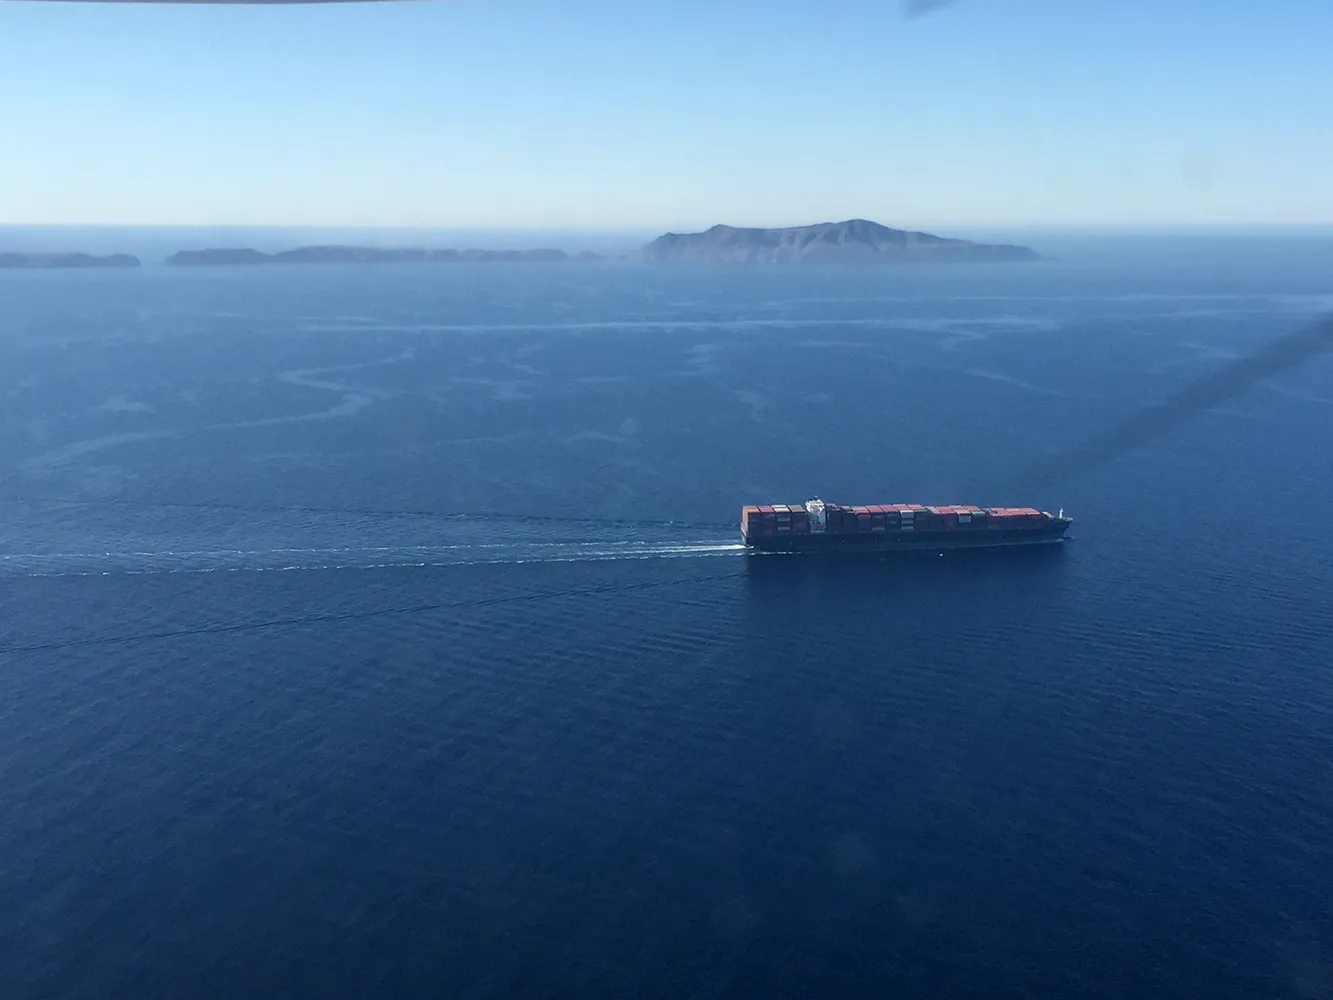
A large cargo ship sails across calm blue ocean water, with an island visible in the distance.

Photo: Jess Morten/NOAA

Why Blue Whales Blue Skies Works

Blue icon with California map, container ship, and two whales, representing ocean activity near the coast.

The VSR season coincides with the time of year endangered whales and air pollution are most prevalent off the CA coast.

Icon of a ship above waves with the text "10 kts" on a blue circular background.

Traveling at 10 knots or less significantly reduces the risk of fatal ship strikes.

Icon of binoculars, ocean waves, and a whale, symbolizing whale watching on a blue circle background.

Participants provide valuable whale sightings data that is used in conjunction with scientific research/survey data.

Icon of three whales below wavy lines and warning sign, indicating danger or caution for whales in water.

BWBS quickly releases notices when large numbers of endangered whales are present in VSR zones to increase awareness of critical ship strike risk days to all mariners.

Reducing Whale Strikes

The 2024 Season marked the highest enrollment and cooperation rates to date. Collectively, participating fleets in the program traveled ~426,000 nautical miles at "whale-safer" 10 knots or less. Shipping lines qualifying for the top Sapphire award, with 85%+ total distance traveled at whale safer speed, almost doubled from the prior season, from 13 to 23 lines.

Photo: Adam Ernster

Methods for Measuring Whale Strikes

Ship strike risk is estimated from a model found in Rockwood et al. 2020. Components of the model depend on the encounter rate between whales and vessels, the probability of mortality given a collision, and the probability of active avoidance by whales.

Expand

Documented ship strike deaths are severely underestimated for large whales

Expand

Which species does the BWBS program benefit?

Expand

Why does the program start in May?

Verification Partners

Reducing Air Pollution

Emission reductions (NOx, SOx, DPM, CO2e) for each VSR season are estimated by looking at the difference in emissions between each participating vessel at its estimated baseline speed and emissions based on the speeds observed during the VSR season.

Photo: Laura Kranzler

Methods for Measuring NOx Reduction

Emission reductions are calculated for each season by looking at the difference in emissions between the participating vessels at their estimated baseline speed and the actual emissions at their VSR-compliant speeds.

Expand

Are there any studies that evaluate the fuel efficiency implications or economic costs of vessel speed reduction?

Verification Partners

Reducing Underwater Noise

Underwater noise reductions associated with the program are determined by comparing source levels of participating vessels during the VSR season versus outside the VSR season. The program partners with the Whale Acoustics lab, at the Scripps Institute of Oceanography for underwater noise analysis.

Photo: WhaleSafe

Methods for Measuring Underwater Noise

Analysis of underwater radiated noise metrics (source level and noise level) at three sites, the Santa Barbara Channel, Monterey Bay, and San Francisco.
Expand

How do you record underwater noise?

Expand

How long has underwater noise been monitored?

Verification Partners

A cargo ship sailing through calm blue ocean water, leaving a white wake behind.

Take The Next Step

Join a growing movement of industry leaders—enroll your fleet to reduce whale strikes, improve air quality, and gain recognition for sustainable shipping.

Photo: Jess Morten ©2016 NOAA

Scroll To Top